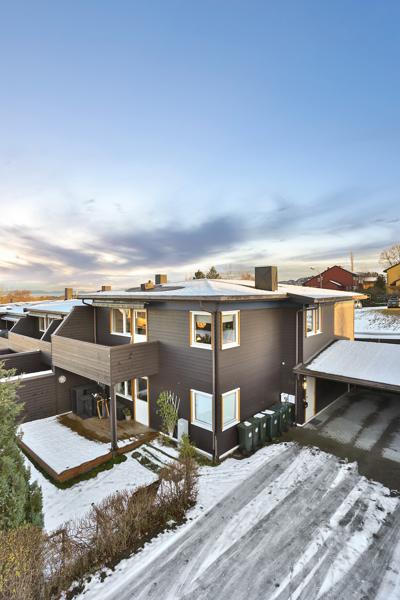
Moholt Trondheim Beta
Part of Trondheim · The housing market in Norway · Most expensive homes
Price development
Median price per m², rolling 4 quarters
Show as table
| Quarter | Apartments (kr/m²) | Houses (kr/m²) |
|---|---|---|
| Q3 2006 | 29 767 | 15 512 |
| Q4 2006 | 29 767 | 17 255 |
| Q1 2007 | 29 096 | 21 236 |
| Q2 2007 | 28 848 | 21 138 |
| Q3 2007 | 27 568 | 21 333 |
| Q4 2007 | 25 000 | 21 980 |
| Q1 2008 | 24 545 | 21 726 |
| Q2 2008 | 25 370 | 19 938 |
| Q3 2008 | 25 740 | 20 416 |
| Q4 2008 | 25 000 | |
| Q1 2009 | 24 907 | |
| Q2 2009 | 22 023 | |
| Q3 2009 | 23 020 | 21 332 |
| Q4 2009 | 21 892 | 21 257 |
| Q1 2010 | 24 452 | 21 976 |
| Q2 2010 | 24 823 | 22 006 |
| Q3 2010 | 24 772 | 21 766 |
| Q4 2010 | 26 136 | 22 305 |
| Q1 2011 | 26 136 | 21 505 |
| Q2 2011 | 28 282 | 21 505 |
| Q3 2011 | 26 581 | 21 952 |
| Q4 2011 | 29 411 | 21 866 |
| Q1 2012 | 30 776 | 21 866 |
| Q2 2012 | 29 200 | 22 191 |
| Q3 2012 | 30 540 | |
| Q4 2012 | 28 888 | |
| Q1 2013 | 34 634 | |
| Q2 2013 | 39 516 | |
| Q3 2013 | 43 217 | 26 433 |
| Q4 2013 | 42 976 | 27 528 |
| Q1 2014 | 38 164 | 27 750 |
| Q2 2014 | 29 926 | 27 750 |
| Q3 2014 | 30 337 | 26 966 |
| Q4 2014 | 30 585 | 24 175 |
| Q1 2015 | 31 188 | 23 352 |
| Q2 2015 | 35 263 | 26 248 |
| Q3 2015 | 39 090 | |
| Q4 2015 | 38 863 | |
| Q1 2016 | 39 302 | |
| Q2 2016 | 37 727 | 36 171 |
| Q3 2016 | 39 818 | 36 309 |
| Q4 2016 | 38 095 | 33 893 |
| Q1 2017 | 38 202 | 33 724 |
| Q2 2017 | 37 724 | 31 927 |
| Q3 2017 | 35 353 | 34 161 |
| Q4 2017 | 35 786 | 34 333 |
| Q1 2018 | 35 554 | 31 052 |
| Q2 2018 | 37 078 | 31 081 |
| Q3 2018 | 38 470 | 31 081 |
| Q4 2018 | 40 823 | 31 081 |
| Q1 2019 | 40 838 | 37 838 |
| Q2 2019 | 41 363 | 37 156 |
| Q3 2019 | 41 816 | 38 069 |
| Q4 2019 | 39 452 | 34 706 |
| Q1 2020 | 36 474 | 33 676 |
| Q2 2020 | 36 983 | 33 676 |
| Q3 2020 | 37 078 | 33 676 |
| Q4 2020 | 38 539 | 34 968 |
| Q1 2021 | 39 344 | |
| Q2 2021 | 39 344 | |
| Q3 2021 | 40 795 | |
| Q4 2021 | 41 599 | 41 192 |
| Q1 2022 | 42 833 | |
| Q2 2022 | 43 698 | 42 689 |
| Q3 2022 | 45 345 | 42 689 |
| Q4 2022 | 45 294 | |
| Q1 2023 | 44 250 | |
| Q2 2023 | 45 147 | |
| Q3 2023 | 45 000 | 43 430 |
| Q4 2023 | 45 876 | 42 978 |
| Q1 2024 | 47 784 | 45 264 |
| Q2 2024 | 45 000 | 39 242 |
| Q3 2024 | 47 252 | 35 400 |
| Q4 2024 | 45 083 | 36 315 |
| Q1 2025 | 44 705 | 34 901 |
| Q2 2025 | 46 044 | 36 496 |
| Q3 2025 | 48 000 | 34 360 |
| Q4 2025 | 48 080 | 33 672 |
| Q1 2026 | 48 417 | 27 192 |
| Q2 2026 | 46 072 | 28 392 |
Market temperature
Typically sells −0,5 % vs. asking price (106 sales last 12 mo.) · Typically 20 days on market
Show as table
| Quarter | Over/under asking price | Days on market |
|---|---|---|
| Q1 2021 | +0,0 % | |
| Q2 2021 | +0,0 % | |
| Q3 2021 | +2,9 % | 38 |
| Q4 2021 | +3,0 % | 34 |
| Q1 2022 | +4,7 % | 26 |
| Q2 2022 | +5,3 % | 13 |
| Q3 2022 | +5,1 % | 10 |
| Q4 2022 | +6,3 % | 10 |
| Q1 2023 | +4,7 % | 10 |
| Q2 2023 | +4,7 % | 11 |
| Q3 2023 | +0,8 % | 12 |
| Q4 2023 | +0,9 % | 12 |
| Q1 2024 | +2,2 % | 13 |
| Q2 2024 | −1,3 % | 20 |
| Q3 2024 | +0,0 % | 12 |
| Q4 2024 | +0,0 % | 20 |
| Q1 2025 | +0,4 % | 11 |
| Q2 2025 | +1,8 % | 12 |
| Q3 2025 | +1,1 % | 20 |
| Q4 2025 | +0,8 % | 20 |
| Q1 2026 | +0,0 % | 20 |
| Q2 2026 | −0,5 % | 20 |
Asking price vs. sale price
One dot per sale the last 12 months. Dots on the line sold at asking price — click a dot to open the home.
Who lives here?
3 638 residents (2026) · Share of residents per age group, compared with the municipality and Norway
Risvollan - Othilienborg
Household and income figures cover the wider district Risvollan - Othilienborg

48 %
living alone

24 %
couples without children

16 %
couples with children

3 %
single parents

609 800 kr
Median household income after tax (2024)
Trondheim: 659 600 kr · Norway: 676 100 kr
Source: Statistisk sentralbyrå (CC BY 4.0)
Housing stock
3 619 homes in the area, by type
Source: Matrikkelen (Kartverket)
Nearby areas
Homes for sale in Moholt (14)