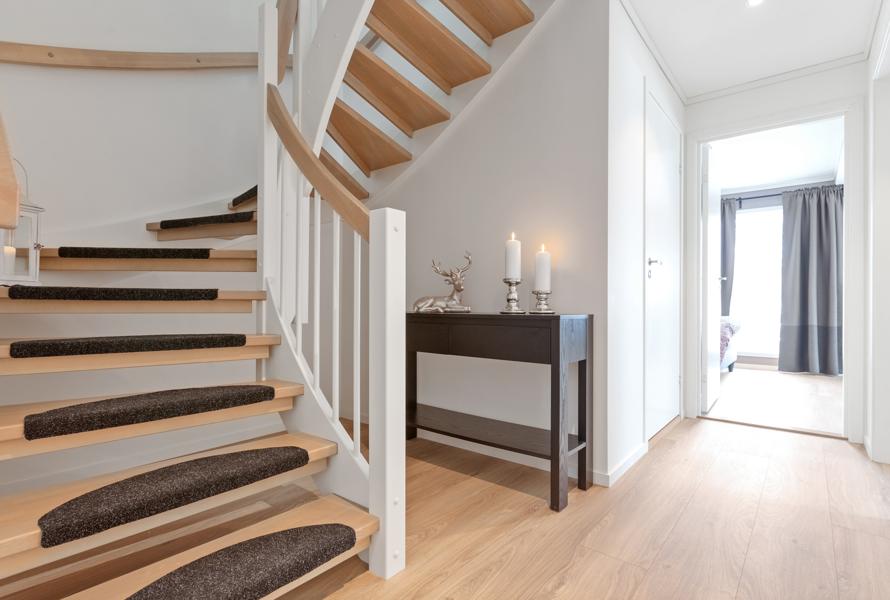
Angelltrøa Trondheim Beta
Part of Trondheim · The housing market in Norway · Most expensive homes
Price development
Median price per m², rolling 4 quarters
Show as table
| Quarter | Apartments (kr/m²) | Houses (kr/m²) |
|---|---|---|
| Q2 2006 | 30 309 | 21 873 |
| Q3 2006 | 30 590 | 20 988 |
| Q4 2006 | 30 590 | 20 244 |
| Q1 2007 | 30 309 | 17 248 |
| Q2 2007 | 30 651 | 19 074 |
| Q3 2007 | 31 590 | 18 794 |
| Q4 2007 | 31 682 | 19 192 |
| Q1 2008 | 33 648 | 19 876 |
| Q2 2008 | 33 636 | 18 225 |
| Q3 2008 | 33 055 | 18 904 |
| Q4 2008 | 32 870 | 18 217 |
| Q1 2009 | 32 316 | 19 571 |
| Q2 2009 | 32 000 | 20 065 |
| Q3 2009 | 32 380 | 18 412 |
| Q4 2009 | 32 380 | 20 674 |
| Q1 2010 | 33 046 | 19 664 |
| Q2 2010 | 33 833 | 21 250 |
| Q3 2010 | 35 454 | 21 241 |
| Q4 2010 | 38 026 | 19 890 |
| Q1 2011 | 40 000 | 20 890 |
| Q2 2011 | 40 513 | 21 232 |
| Q3 2011 | 39 040 | 23 026 |
| Q4 2011 | 42 105 | 23 853 |
| Q1 2012 | 41 551 | 24 657 |
| Q2 2012 | 43 788 | 24 657 |
| Q3 2012 | 47 470 | 25 538 |
| Q4 2012 | 48 303 | 25 171 |
| Q1 2013 | 49 166 | 26 546 |
| Q2 2013 | 46 296 | 26 614 |
| Q3 2013 | 47 500 | 26 222 |
| Q4 2013 | 45 754 | 26 768 |
| Q1 2014 | 45 758 | 25 740 |
| Q2 2014 | 44 444 | 25 740 |
| Q3 2014 | 47 521 | 24 328 |
| Q4 2014 | 48 666 | 22 944 |
| Q1 2015 | 54 000 | 23 972 |
| Q2 2015 | 55 000 | 23 492 |
| Q3 2015 | 47 222 | |
| Q4 2015 | 47 222 | 31 004 |
| Q1 2016 | 46 721 | 31 420 |
| Q2 2016 | 46 694 | 31 624 |
| Q3 2016 | 48 157 | 32 194 |
| Q4 2016 | 48 767 | 30 494 |
| Q1 2017 | 49 166 | 31 191 |
| Q2 2017 | 51 855 | 34 516 |
| Q3 2017 | 54 918 | 34 626 |
| Q4 2017 | 55 484 | 35 552 |
| Q1 2018 | 55 484 | 35 661 |
| Q2 2018 | 53 300 | 35 866 |
| Q3 2018 | 54 651 | 41 100 |
| Q4 2018 | 54 729 | 38 732 |
| Q1 2019 | 54 640 | 36 734 |
| Q2 2019 | 55 396 | 34 875 |
| Q3 2019 | 55 383 | 33 538 |
| Q4 2019 | 55 834 | 33 716 |
| Q1 2020 | 57 457 | 34 623 |
| Q2 2020 | 60 000 | 33 968 |
| Q3 2020 | 61 800 | 34 623 |
| Q4 2020 | 60 714 | 34 554 |
| Q1 2021 | 61 000 | 34 446 |
| Q2 2021 | 59 490 | 37 453 |
| Q3 2021 | 58 494 | 39 292 |
| Q4 2021 | 59 652 | 39 152 |
| Q1 2022 | 62 037 | 39 152 |
| Q2 2022 | 62 631 | 40 123 |
| Q3 2022 | 66 904 | 40 123 |
| Q4 2022 | 68 245 | 41 662 |
| Q1 2023 | 68 812 | 40 924 |
| Q2 2023 | 68 245 | 40 189 |
| Q3 2023 | 68 055 | 40 300 |
| Q4 2023 | 68 812 | 40 189 |
| Q1 2024 | 68 844 | 43 939 |
| Q2 2024 | 68 286 | 44 696 |
| Q3 2024 | 66 185 | 43 642 |
| Q4 2024 | 65 740 | 43 032 |
| Q1 2025 | 64 453 | 40 457 |
| Q2 2025 | 65 120 | |
| Q3 2025 | 67 213 | 38 516 |
| Q4 2025 | 66 662 | 39 149 |
| Q1 2026 | 66 018 | 40 194 |
| Q2 2026 | 65 470 | 39 388 |
Market temperature
Typically sells +0,0 % vs. asking price (58 sales last 12 mo.) · Typically 20 days on market
Show as table
| Quarter | Over/under asking price | Days on market |
|---|---|---|
| Q2 2021 | +0,0 % | |
| Q3 2021 | +0,0 % | 38 |
| Q4 2021 | +0,0 % | 36 |
| Q1 2022 | +1,4 % | 36 |
| Q2 2022 | +0,3 % | 23 |
| Q3 2022 | +1,5 % | 12 |
| Q4 2022 | +2,7 % | 11 |
| Q1 2023 | +2,0 % | 11 |
| Q2 2023 | +2,1 % | 11 |
| Q3 2023 | +0,3 % | |
| Q4 2023 | +0,0 % | |
| Q1 2024 | +0,0 % | 10 |
| Q2 2024 | −0,5 % | |
| Q3 2024 | −1,2 % | 10 |
| Q4 2024 | +0,0 % | 11 |
| Q1 2025 | +0,0 % | 11 |
| Q2 2025 | +0,7 % | 10 |
| Q3 2025 | +0,5 % | 11 |
| Q4 2025 | +0,0 % | 20 |
| Q1 2026 | +0,0 % | 20 |
| Q2 2026 | +0,0 % | 20 |
Asking price vs. sale price
One dot per sale the last 12 months. Dots on the line sold at asking price — click a dot to open the home.
Who lives here?
2 648 residents (2026) · Share of residents per age group, compared with the municipality and Norway
Åsvang - Stokkan
Household and income figures cover the wider district Åsvang - Stokkan

42 %
living alone

29 %
couples without children

17 %
couples with children

2 %
single parents

693 900 kr
Median household income after tax (2024)
Trondheim: 659 600 kr · Norway: 676 100 kr
Source: Statistisk sentralbyrå (CC BY 4.0)
Housing stock
1 337 homes in the area, by type
Source: Matrikkelen (Kartverket)
Nearby areas
Homes for sale in Angelltrøa (4)