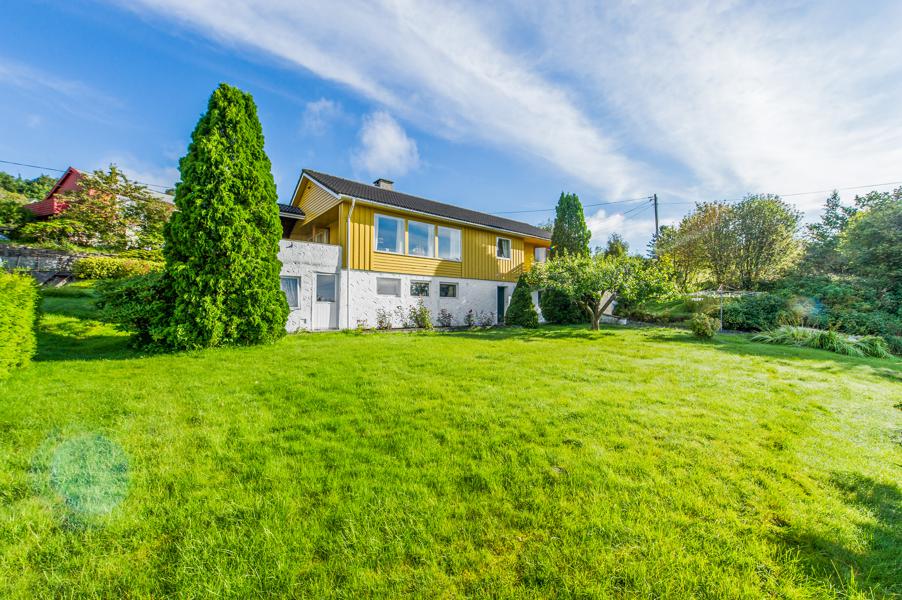
Os Bjørnafjorden Beta
Part of Bjørnafjorden · The housing market in Norway · Most expensive homes
Price development
Median price per m², rolling 4 quarters
Show as table
| Quarter | Apartments (kr/m²) | Houses (kr/m²) |
|---|---|---|
| Q2 2006 | 21 118 | 14 032 |
| Q3 2006 | 25 190 | 14 122 |
| Q4 2006 | 24 108 | 14 165 |
| Q1 2007 | 26 520 | 13 898 |
| Q2 2007 | 143 020 | 14 016 |
| Q3 2007 | 24 959 | 13 661 |
| Q4 2007 | 24 305 | 14 406 |
| Q1 2008 | 24 419 | 14 677 |
| Q2 2008 | 23 642 | 14 563 |
| Q3 2008 | 22 517 | 15 218 |
| Q4 2008 | 22 840 | 15 103 |
| Q1 2009 | 22 154 | 15 253 |
| Q2 2009 | 21 875 | 14 510 |
| Q3 2009 | 22 344 | 13 636 |
| Q4 2009 | 22 375 | 13 614 |
| Q1 2010 | 23 550 | 13 636 |
| Q2 2010 | 28 000 | 14 366 |
| Q3 2010 | 27 364 | 16 250 |
| Q4 2010 | 29 054 | 16 560 |
| Q1 2011 | 29 054 | 16 960 |
| Q2 2011 | 26 470 | 17 137 |
| Q3 2011 | 28 768 | 17 480 |
| Q4 2011 | 25 301 | 18 369 |
| Q1 2012 | 26 363 | 18 185 |
| Q2 2012 | 27 453 | 18 981 |
| Q3 2012 | 32 407 | 18 518 |
| Q4 2012 | 32 786 | 17 857 |
| Q1 2013 | 35 758 | 18 461 |
| Q2 2013 | 38 084 | 18 616 |
| Q3 2013 | 36 534 | 17 570 |
| Q4 2013 | 37 295 | 18 684 |
| Q1 2014 | 35 573 | 19 097 |
| Q2 2014 | 34 264 | 19 300 |
| Q3 2014 | 31 935 | 20 231 |
| Q4 2014 | 31 935 | 18 971 |
| Q1 2015 | 31 875 | 19 135 |
| Q2 2015 | 32 904 | 19 180 |
| Q3 2015 | 33 333 | 19 442 |
| Q4 2015 | 33 695 | 21 310 |
| Q1 2016 | 27 272 | 22 305 |
| Q2 2016 | 30 696 | 22 273 |
| Q3 2016 | 31 250 | 22 282 |
| Q4 2016 | 31 884 | 22 425 |
| Q1 2017 | 39 823 | 22 945 |
| Q2 2017 | 37 673 | 23 931 |
| Q3 2017 | 34 045 | 23 631 |
| Q4 2017 | 33 666 | 22 945 |
| Q1 2018 | 33 666 | 22 527 |
| Q2 2018 | 34 000 | 22 282 |
| Q3 2018 | 34 420 | 22 230 |
| Q4 2018 | 35 688 | 22 687 |
| Q1 2019 | 34 420 | 24 658 |
| Q2 2019 | 37 142 | 24 626 |
| Q3 2019 | 36 168 | 24 236 |
| Q4 2019 | 38 984 | 24 236 |
| Q1 2020 | 38 984 | 22 457 |
| Q2 2020 | 36 595 | 23 530 |
| Q3 2020 | 36 595 | 23 504 |
| Q4 2020 | 34 523 | 23 461 |
| Q1 2021 | 36 330 | 25 550 |
| Q2 2021 | 37 500 | 26 315 |
| Q3 2021 | 36 933 | 26 540 |
| Q4 2021 | 40 277 | 28 192 |
| Q1 2022 | 37 127 | 27 777 |
| Q2 2022 | 36 989 | 27 472 |
| Q3 2022 | 39 006 | 27 460 |
| Q4 2022 | 43 967 | 27 310 |
| Q1 2023 | 45 532 | 27 442 |
| Q2 2023 | 51 340 | 28 899 |
| Q3 2023 | 52 690 | 27 920 |
| Q4 2023 | 44 246 | 27 589 |
| Q1 2024 | 44 262 | 27 202 |
| Q2 2024 | 43 750 | 25 392 |
| Q3 2024 | 38 598 | 22 590 |
| Q4 2024 | 40 434 | 21 739 |
| Q1 2025 | 40 550 | 26 115 |
| Q2 2025 | 40 434 | 27 026 |
| Q3 2025 | 43 496 | 31 223 |
| Q4 2025 | 47 014 | 31 196 |
| Q1 2026 | 47 258 | 29 888 |
| Q2 2026 | 47 827 | 31 707 |
Market temperature
Typically sells +0,2 % vs. asking price (53 sales last 12 mo.) · Typically 10 days on market
Show as table
| Quarter | Over/under asking price | Days on market |
|---|---|---|
| Q2 2021 | −1,2 % | |
| Q3 2021 | +0,0 % | |
| Q4 2021 | −1,2 % | 51 |
| Q1 2022 | −1,2 % | 24 |
| Q2 2022 | +0,0 % | 14 |
| Q3 2022 | +0,0 % | 10 |
| Q4 2022 | +0,0 % | 10 |
| Q1 2023 | +0,0 % | 11 |
| Q2 2023 | −1,2 % | 20 |
| Q3 2023 | −1,2 % | 26 |
| Q4 2023 | −1,7 % | 26 |
| Q1 2024 | −1,7 % | 20 |
| Q2 2024 | −1,4 % | 20 |
| Q3 2024 | −1,7 % | 20 |
| Q4 2024 | −1,6 % | 20 |
| Q1 2025 | −1,7 % | 11 |
| Q2 2025 | −0,8 % | 10 |
| Q3 2025 | +0,0 % | 10 |
| Q4 2025 | +0,0 % | 10 |
| Q1 2026 | +0,0 % | 10 |
| Q2 2026 | +0,2 % | 10 |
Asking price vs. sale price
One dot per sale the last 12 months. Dots on the line sold at asking price — click a dot to open the home.
Who lives here?
5 586 residents (2026) · Share of residents per age group, compared with the municipality and Norway
Osøyro
Household and income figures cover the wider district Osøyro

39 %
living alone

24 %
couples without children

20 %
couples with children

5 %
single parents

697 900 kr
Median household income after tax (2024)
Bjørnafjorden: 771 700 kr · Norway: 676 100 kr
Source: Statistisk sentralbyrå (CC BY 4.0)
Housing stock
2 779 homes in the area, by type
Source: Matrikkelen (Kartverket)
Homes for sale in Os (1)