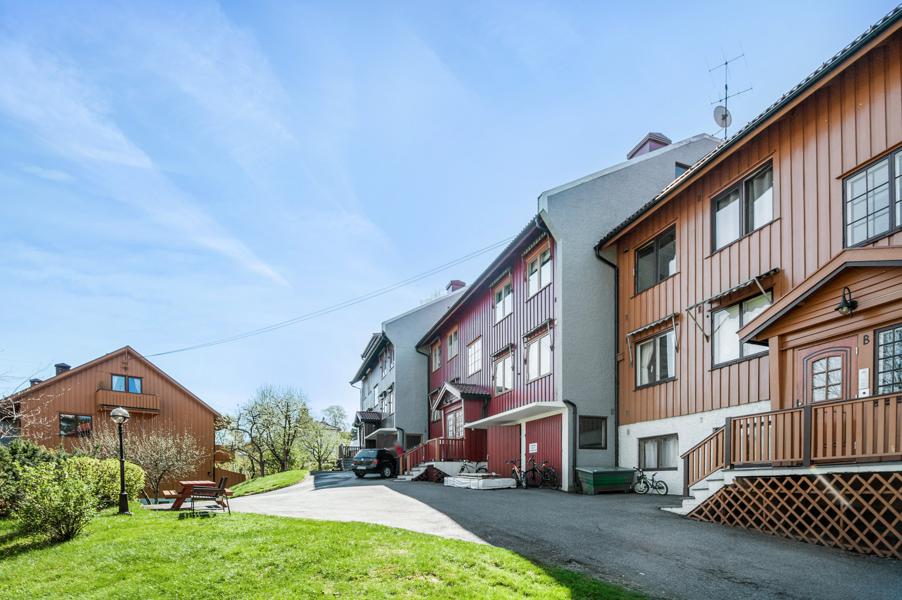
Høyenhall Oslo Beta
Part of Oslo · The housing market in Norway · Most expensive homes
Price development
Median price per m², rolling 4 quarters
Show as table
| Quarter | Apartments (kr/m²) | Houses (kr/m²) |
|---|---|---|
| Q4 2006 | 23 404 | |
| Q1 2007 | 23 125 | |
| Q2 2007 | 30 754 | 24 172 |
| Q3 2007 | 30 781 | 25 988 |
| Q4 2007 | 30 173 | 23 834 |
| Q1 2008 | 29 906 | 26 336 |
| Q2 2008 | 30 032 | 27 873 |
| Q3 2008 | 28 906 | 29 781 |
| Q4 2008 | 29 038 | 29 808 |
| Q1 2009 | 23 046 | 29 255 |
| Q2 2009 | 17 728 | 28 400 |
| Q3 2009 | 15 500 | 28 225 |
| Q4 2009 | 21 752 | 28 096 |
| Q1 2010 | 27 884 | 28 341 |
| Q2 2010 | 29 716 | 28 066 |
| Q3 2010 | 29 716 | 30 178 |
| Q4 2010 | 30 597 | 32 049 |
| Q1 2011 | 31 617 | 31 710 |
| Q2 2011 | 31 600 | 32 327 |
| Q3 2011 | 32 476 | 32 250 |
| Q4 2011 | 33 725 | 30 270 |
| Q1 2012 | 34 126 | 37 218 |
| Q2 2012 | 35 820 | 35 326 |
| Q3 2012 | 37 602 | 37 464 |
| Q4 2012 | 38 307 | 39 808 |
| Q1 2013 | 39 030 | 40 638 |
| Q2 2013 | 40 000 | 42 241 |
| Q3 2013 | 40 000 | 39 261 |
| Q4 2013 | 40 740 | 40 382 |
| Q1 2014 | 40 151 | 43 176 |
| Q2 2014 | 40 094 | 43 000 |
| Q3 2014 | 40 740 | 43 831 |
| Q4 2014 | 41 509 | 41 030 |
| Q1 2015 | 42 352 | 41 030 |
| Q2 2015 | 42 574 | 45 609 |
| Q3 2015 | 44 117 | 47 182 |
| Q4 2015 | 45 967 | 47 706 |
| Q1 2016 | 46 226 | |
| Q2 2016 | 48 148 | |
| Q3 2016 | 50 000 | 54 961 |
| Q4 2016 | 53 798 | 55 042 |
| Q1 2017 | 57 138 | 58 411 |
| Q2 2017 | 58 333 | 58 411 |
| Q3 2017 | 59 677 | 58 896 |
| Q4 2017 | 58 114 | 59 523 |
| Q1 2018 | 55 576 | 58 896 |
| Q2 2018 | 55 151 | 59 333 |
| Q3 2018 | 54 177 | 60 514 |
| Q4 2018 | 55 803 | 53 164 |
| Q1 2019 | 56 250 | 53 005 |
| Q2 2019 | 55 882 | 53 250 |
| Q3 2019 | 56 512 | 53 079 |
| Q4 2019 | 56 923 | 56 923 |
| Q1 2020 | 57 138 | 57 714 |
| Q2 2020 | 57 598 | 56 015 |
| Q3 2020 | 57 843 | 58 668 |
| Q4 2020 | 58 955 | 59 354 |
| Q1 2021 | 58 257 | 58 196 |
| Q2 2021 | 59 467 | 62 592 |
| Q3 2021 | 59 523 | 68 694 |
| Q4 2021 | 59 762 | 71 290 |
| Q1 2022 | 61 956 | 73 042 |
| Q2 2022 | 62 500 | 73 273 |
| Q3 2022 | 62 963 | 73 273 |
| Q4 2022 | 63 235 | 73 170 |
| Q1 2023 | 65 094 | 72 847 |
| Q2 2023 | 66 666 | 67 692 |
| Q3 2023 | 66 981 | 73 170 |
| Q4 2023 | 66 617 | 68 395 |
| Q1 2024 | 65 250 | 62 978 |
| Q2 2024 | 63 818 | 59 740 |
| Q3 2024 | 61 834 | 58 394 |
| Q4 2024 | 62 310 | 54 808 |
| Q1 2025 | 62 686 | 53 631 |
| Q2 2025 | 63 630 | 60 759 |
| Q3 2025 | 69 444 | 61 000 |
| Q4 2025 | 72 222 | 73 126 |
| Q1 2026 | 74 074 | 74 166 |
| Q2 2026 | 72 348 | 68 156 |
Market temperature
Typically sells +2,0 % vs. asking price (64 sales last 12 mo.) · Typically 10 days on market
Show as table
| Quarter | Over/under asking price | Days on market |
|---|---|---|
| Q1 2021 | +4,6 % | |
| Q2 2021 | +7,1 % | |
| Q3 2021 | +6,9 % | |
| Q4 2021 | +5,6 % | 25 |
| Q1 2022 | +4,6 % | 20 |
| Q2 2022 | +1,7 % | 12 |
| Q3 2022 | +1,3 % | 11 |
| Q4 2022 | +0,3 % | 11 |
| Q1 2023 | +0,0 % | 12 |
| Q2 2023 | +0,0 % | 13 |
| Q3 2023 | +0,0 % | 13 |
| Q4 2023 | −0,5 % | 13 |
| Q1 2024 | −0,5 % | 12 |
| Q2 2024 | +0,0 % | 10 |
| Q3 2024 | +0,0 % | 10 |
| Q4 2024 | +0,0 % | 10 |
| Q1 2025 | +0,0 % | 10 |
| Q2 2025 | +0,3 % | 10 |
| Q3 2025 | +2,3 % | 10 |
| Q4 2025 | +2,1 % | 10 |
| Q1 2026 | +2,1 % | 10 |
| Q2 2026 | +2,0 % | 10 |
Asking price vs. sale price
One dot per sale the last 12 months. Dots on the line sold at asking price — click a dot to open the home.
Who lives here?
4 422 residents (2026) · Share of residents per age group, compared with the municipality and Norway
Østensjø
Household and income figures cover the wider district Østensjø

42 %
living alone

20 %
couples without children

23 %
couples with children

4 %
single parents

720 500 kr
Median household income after tax (2024)
Oslo: 635 200 kr · Norway: 676 100 kr
Source: Statistisk sentralbyrå (CC BY 4.0)
Housing stock
2 120 homes in the area, by type
Source: Matrikkelen (Kartverket)
Nearby areas
Homes for sale in Høyenhall (2)