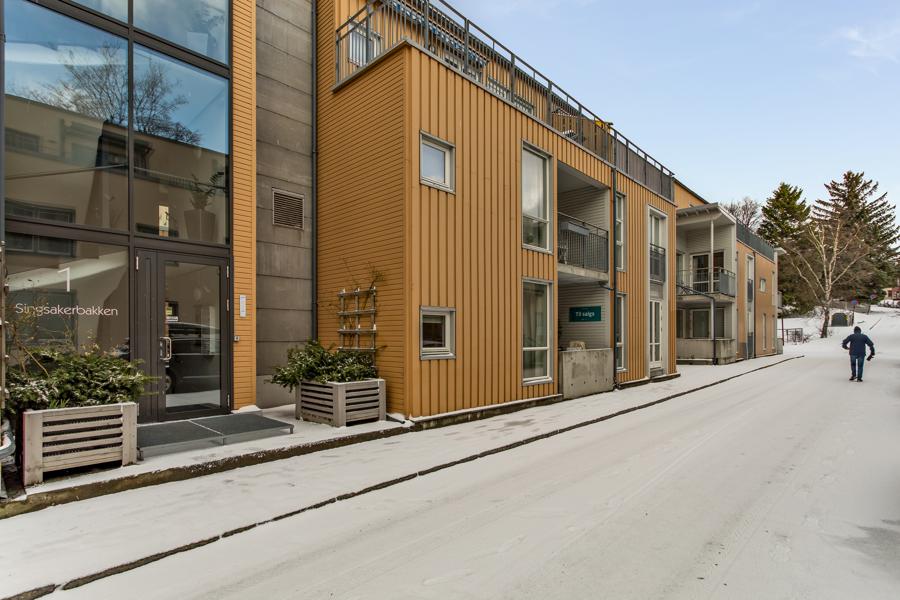
Bakklandet Trondheim Beta
Part of Trondheim · The housing market in Norway · Most expensive homes
Price development
Median price per m², rolling 4 quarters
Show as table
| Quarter | Apartments (kr/m²) | Houses (kr/m²) |
|---|---|---|
| Q2 2006 | 30 384 | |
| Q3 2006 | 33 717 | |
| Q4 2006 | 33 822 | |
| Q1 2007 | 33 717 | |
| Q2 2007 | 33 750 | |
| Q3 2007 | 33 333 | 23 756 |
| Q4 2007 | 33 424 | 27 692 |
| Q1 2008 | 32 661 | 28 905 |
| Q2 2008 | 33 333 | 28 546 |
| Q3 2008 | 34 228 | 27 464 |
| Q4 2008 | 33 630 | 26 722 |
| Q1 2009 | 37 142 | 28 000 |
| Q2 2009 | 41 880 | 25 714 |
| Q3 2009 | 43 720 | |
| Q4 2009 | 43 244 | 30 456 |
| Q1 2010 | 38 176 | 30 000 |
| Q2 2010 | 37 727 | 30 000 |
| Q3 2010 | 37 874 | 30 913 |
| Q4 2010 | 38 138 | 28 892 |
| Q1 2011 | 38 704 | 27 992 |
| Q2 2011 | 39 743 | 27 192 |
| Q3 2011 | 40 476 | 27 192 |
| Q4 2011 | 40 346 | |
| Q1 2012 | 41 509 | |
| Q2 2012 | 42 066 | |
| Q3 2012 | 44 754 | 31 318 |
| Q4 2012 | 45 200 | 31 168 |
| Q1 2013 | 44 827 | 31 820 |
| Q2 2013 | 45 238 | 29 787 |
| Q3 2013 | 47 960 | |
| Q4 2013 | 47 959 | |
| Q1 2014 | 48 103 | |
| Q2 2014 | 47 538 | |
| Q3 2014 | 48 122 | 36 962 |
| Q4 2014 | 50 000 | 39 375 |
| Q1 2015 | 50 675 | 37 640 |
| Q2 2015 | 50 714 | 44 652 |
| Q3 2015 | 51 052 | 42 868 |
| Q4 2015 | 50 644 | 42 812 |
| Q1 2016 | 51 052 | 42 812 |
| Q2 2016 | 53 084 | 42 812 |
| Q3 2016 | 56 896 | 46 560 |
| Q4 2016 | 61 572 | |
| Q1 2017 | 62 500 | |
| Q2 2017 | 62 930 | |
| Q3 2017 | 63 886 | 51 798 |
| Q4 2017 | 63 818 | 48 437 |
| Q1 2018 | 62 678 | |
| Q2 2018 | 61 603 | |
| Q3 2018 | 63 392 | 50 497 |
| Q4 2018 | 60 714 | 51 401 |
| Q1 2019 | 60 982 | 50 497 |
| Q2 2019 | 61 802 | 51 401 |
| Q3 2019 | 59 615 | |
| Q4 2019 | 61 636 | 43 981 |
| Q1 2020 | 62 000 | 44 122 |
| Q2 2020 | 63 056 | 47 562 |
| Q3 2020 | 63 220 | |
| Q4 2020 | 64 090 | |
| Q1 2021 | 64 406 | |
| Q2 2021 | 63 445 | |
| Q3 2021 | 69 086 | |
| Q4 2021 | 70 192 | 57 089 |
| Q1 2022 | 65 662 | 58 571 |
| Q2 2022 | 67 500 | 64 957 |
| Q3 2022 | 64 786 | 58 730 |
| Q4 2022 | 64 786 | |
| Q1 2023 | 68 030 | |
| Q2 2023 | 69 696 | |
| Q3 2023 | 70 076 | |
| Q4 2023 | 68 783 | 61 363 |
| Q1 2024 | 69 416 | 61 363 |
| Q2 2024 | 64 839 | 53 006 |
| Q3 2024 | 63 679 | 54 347 |
| Q4 2024 | 64 230 | 50 781 |
| Q1 2025 | 63 679 | 46 586 |
| Q2 2025 | 66 949 | 46 296 |
| Q3 2025 | 69 624 | 46 296 |
| Q4 2025 | 70 631 | |
| Q1 2026 | 72 016 | |
| Q2 2026 | 70 121 |
Market temperature
Typically sells −1,7 % vs. asking price (72 sales last 12 mo.) · Typically 20 days on market
Show as table
| Quarter | Over/under asking price | Days on market |
|---|---|---|
| Q2 2021 | +2,2 % | |
| Q3 2021 | +4,4 % | |
| Q4 2021 | +3,0 % | 48 |
| Q1 2022 | +1,3 % | 33 |
| Q2 2022 | +1,2 % | 23 |
| Q3 2022 | +0,2 % | 14 |
| Q4 2022 | +0,2 % | 13 |
| Q1 2023 | +0,0 % | 12 |
| Q2 2023 | +0,0 % | 22 |
| Q3 2023 | −0,4 % | |
| Q4 2023 | −0,4 % | |
| Q1 2024 | −1,8 % | 20 |
| Q2 2024 | −1,9 % | 20 |
| Q3 2024 | −1,2 % | 20 |
| Q4 2024 | −1,5 % | 20 |
| Q1 2025 | −1,9 % | 21 |
| Q2 2025 | −1,9 % | 21 |
| Q3 2025 | −2,0 % | 20 |
| Q4 2025 | −2,3 % | 20 |
| Q1 2026 | −2,2 % | 20 |
| Q2 2026 | −1,7 % | 20 |
Asking price vs. sale price
One dot per sale the last 12 months. Dots on the line sold at asking price — click a dot to open the home.
Who lives here?
3 047 residents (2026) · Share of residents per age group, compared with the municipality and Norway
Øya - Singsaker
Household and income figures cover the wider district Øya - Singsaker

53 %
living alone

25 %
couples without children

11 %
couples with children

2 %
single parents

564 500 kr
Median household income after tax (2024)
Trondheim: 659 600 kr · Norway: 676 100 kr
Source: Statistisk sentralbyrå (CC BY 4.0)
Housing stock
2 613 homes in the area, by type
Source: Matrikkelen (Kartverket)
Nearby areas
Homes for sale in Bakklandet (27)